Growth investing is about identifying companies building transformational products early in a massive growth curve. Anything that doesn’t fit this definition is some form of value investing. It doesn’t matter if the investment is public or private, tech or non-tech. Our job as sell-side analysts was to identify the growth curves that Apple, Amazon, and Facebook built into, just as it is our job now to identify potential curves with less information as early-stage venture investors.
Growth has been in vogue for well over a decade now, and we expect it to stay in vogue given increasing technological disruption. The Internet has made the world local. Companies that successfully own a growth curve result in bigger wins via these winner-take-most global/local dynamics.
Combining our experience in the public and private markets, we’ve created several mental models for growth investing: three types of curves we look for and a grid that pulls it all together.
What is a growth curve?
A growth curve represents two things: market and timing. Market is primarily about the magnitude of the opportunity relative to other markets, but it’s built on a definition of who the customer is, what problem the technology solves for them, and how much economic value that creates. Timing is the current phase of customer adoption in the market and expectations about how quickly adoption will grow, i.e. the steepness of the curve. The earlier the phase of the curve, the tougher it is to predict the ultimate market size. The later the phase, the clearer market size becomes but also the more priced in by investors.
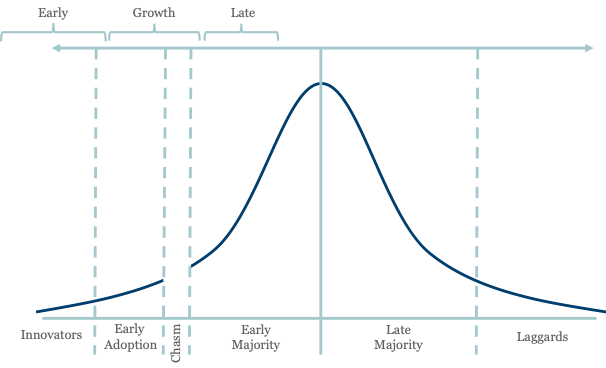
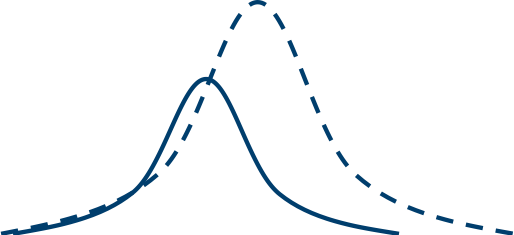
Growth curves are most easily visualized by the Rogers bell curve from Diffusion of Innovation where he identified the five stages of new technology adoption. Geoffrey Moore later added the “chasm” to Rogers’ concept. We’ll use this framework to describe the various growth curves we see.
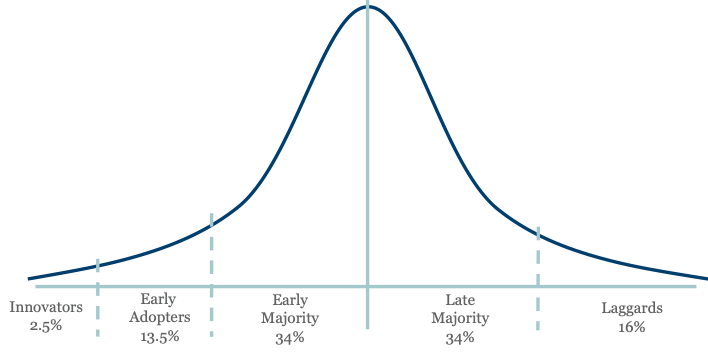
It’s always important to buy assets at a reasonable price relative to future earnings, but it becomes more important the deeper you go into the curve from growth to value. Once a market evolves beyond early majority adoption, it becomes more difficult to qualify it as a growth market. By definition, there is still half of the curve to capture, but by that phase of adoption, the investment community understands the potential for the market and price that into the value of any companies participating in the curve. The best growth companies that enter the second half of their growth curve are compounders with a sustainable competitive advantage that generate consistently growing cash flows. Growth investors want to own these companies early in their growth curve and hold them indefinitely. Value investors buy these companies at reasonable prices after the curve is well defined.
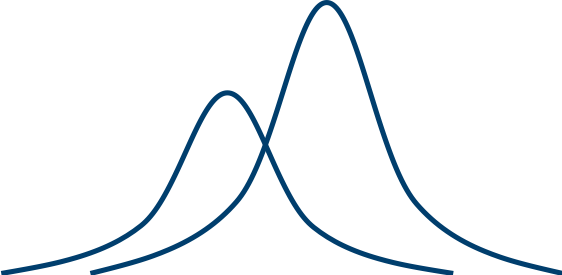
Market Curves vs Company Curves
Growth curves do not happen in a vacuum. At any given time, the overall market is working through multiple specific market growth curves of various size and stage. Investors need to consider growth curves relative to one another in terms of size and stage to find the best opportunities and build a portfolio.
Just as investors choose curves to focus their investment on, companies do too. All companies have a history of growth curves they’ve built into. A company’s history of growth curves dictates the makeup of its investor base and how it will fund going after the current curve in focus. A company on its first curve will likely be reliant on outside capital, while a company that’s experienced a curve before may fund its next curve with internal capital.
The Initial Growth Curve
The initial growth curve is the curve a company builds into after formation. Companies working on initial curves do not have the experience or legacy of having built a business into a prior curve. Therefore, initial curves are primarily the domain of startups and venture investors.
Speaking in generalities, early-stage venture gets a company to early market – establishing that some early adopters want your product for a business or personal need, not pure novelty. Growth-stage venture takes a company through its first major adoption period with early adopters and across the chasm and into the early majority. In the old days, then a company could start to think about going public. Today, late-stage private investors invest as a company captures the first part of the early majority, which is arguably the steepest part of the curve.
 When initial growth curve companies do ultimately reach the public market via IPO, it tends to be well into the early majority part of the adoption curve. As more money enters the private markets, it may continue to push out when public growth investors get access to initial curve companies. However, there are some exceptions to this trend. Tesla is still on its initial curve and arguably still in the innovator phase of the curve, yet public. The early nature of the EV market has created a volatile environment for Tesla shares as believers and non-believers battle about the reality of Tesla’s viability given the current state of the market.
There are a few investor base differences worth noting as we think about other growth curves. Most initial growth curve companies are in constant need of adding new investors, progressing through phases of adoption lined up with the types of venture capital that funds those phases. While some initial curve companies can fund growth through operating profit, it is usually difficult to do this for the largest and most valuable markets because operating profit is usually lowest in the first half of the curve, and in many cases non-existent, thus it creates a significant speed constraint via limited capital. This is not the case for companies that have already lived through one or more curves.
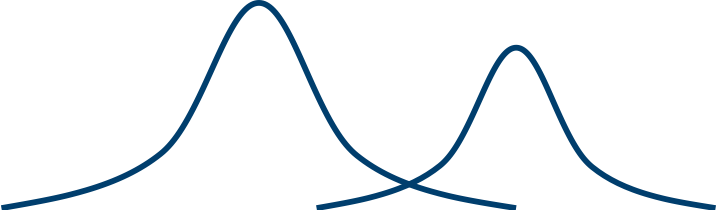
The New Growth Curve
New growth curves happen when established companies reach the end of a previous growth curve and find a new one to build on. Market penetration from the prior curve is mature, and the company is in the profit harvesting phase of the business, allowing it to fund investment into the new curve with profits from the legacy business.
Nvidia was the leader in the mature GPU market by 2016 with solid, stable teens-ish annual revenue growth. Then the company hit on the AI wave, providing the hardware necessary to run computationally intensive software applications. Now Nvidia is focused on serving that much larger long-term opportunity in AI and data centers, which may require investment that would result in short-to-mid-term margin compression. 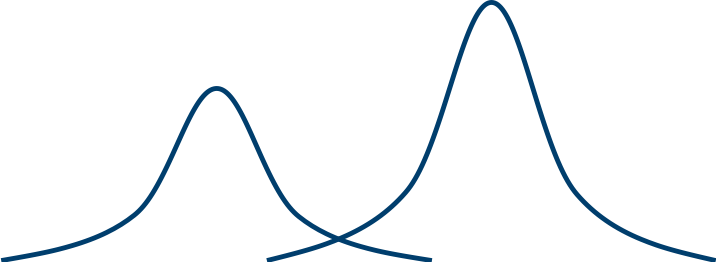
New market curves work best when a company’s existing dominant product can easily serve a customer need in a new market. Nvidia already built the best GPUs. When AI engineers discovered that GPUs were useful in running their software, Nvidia’s market-leading position made them the natural choice for the new use case. After the new curve company establishes a foothold in the new market with minimal changes to its existing product, it can work on building a new product specifically for the new market.
New growth curve companies are found almost exclusively in the public markets because of the necessity of a prior mature curve, whether it’s the initial curve, secondary curve, etc. Private market investors, founders, and employees desire liquidity after achieving success, thus few private companies stay private beyond the first half of their growth curve.
Because new growth curve companies are almost always public, they have investor turnover dynamics different than initial curve companies. Where initial curve companies consistently bring on additional, illiquid private capital through new investors as they progress through the phases of the curve, new curve companies have existing investor bases that either bought into a prior curve as growth investors or viewed the company as a value investment. This creates potential volatility in new curve companies early on in the transition to the new curve as the existing investor base reassesses their holdings. Some investors are likely to exit their positions given the risks of attacking a new curve.
Business Model Curve
Sometimes mature companies evolve their business models in existing markets, rather than build into new markets. This can create a similar effect as a new curve, albeit usually with less upside potential. We think of the new business model curve as a subset of the new growth curve.
Adobe and Microsoft both evolved their business models when they moved to a subscription business from traditional software licensing. Business model innovations generally require little incremental investment but may affect near term revenue during the transition.
Adobe and Microsoft faced near-term revenue headwinds given lower annualized subscription prices compared to one-time software sales, but overall predictability and lifetime customer value improved, resulting in more certain cash flows and higher multiples. In all three of those cases, the “new curve” is a smaller curve than the prior, as business model adaptations tend to be.
Business model curves tend to progress at a faster rate than new market curves because the customer base is already established. Thus, the investor community adjustment to the impact of business model curves usually only lasts a few years while a new market curve can last several years to a decade or even more.
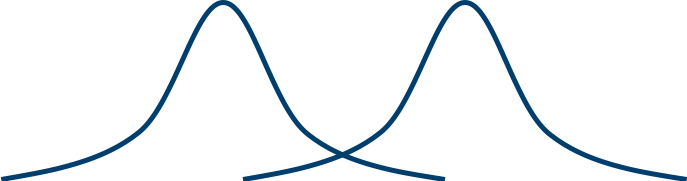
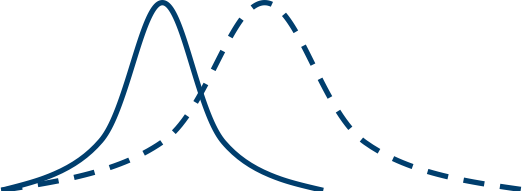
The Double Curve
Sometimes, when a company is in the middle of a building into a curve (initial or new), it discovers an even larger curve. The discovery requires the company to make the hard decision to transition off of its current curve to the new, larger curve. The double curve transition is only valid if the subsequent curve has the potential to be much larger than the current curve. There would be no sense in transitioning to a smaller curve.
Additionally, double curves only work for new markets, not business model changes. A company in the middle of successful penetration of a curve should not change its business model because it could confuse customers and risk stalling adoption.
The hallmarks of a double curve company are solid topline growth, often higher than 20% y/y with decent but not great margins. Penetration of the company’s core growth product might be 15-35%
Two double curve examples are Apple and Netflix.
Apple was only a few years into the iPod curve when it began work on the iPhone. Launching the iPhone in 2007 forced the company to deemphasize the iPod which was still growing units 20% per year when the iPhone launched and likely growing 50% plus when they decided to build the iPhone.
Netflix built a successful DVD-by-mail service over a decade until it saw the opportunity to create its even more successful streaming service in 2010. Netflix was still growing its DVD-by-mail subscriber base by over 40% per year when it launched streaming. The effect of the transition saw operating margins decline from the low-teens to low-single digits and remain below the peak from the DVD business even today, but on a revenue base 7x higher.
Double curve strategies can be painful. As Netflix transitioned its business with separate pricing for DVDs vs streaming only, the stock declined almost 80% peak to trough in 2011. Investors don’t like moving away from a business they knew was good to one that may or may not be even better. That risk aversion creates opportunity for growth investors that see the potential of the second curve. NFLX is up 32x from that 2011 trough.
Double curve companies don’t have to be publicly traded but often are. It’s easier to fund what could be considered a “growth-stage pivot” when a company is profitable (Apple, Netflix). Many companies that go public, even in today’s environment of later IPOs, delay profitability in favor of growth. Thus, late-stage companies often don’t have the profit to fund the pivot to the bigger curve. Given the amount of late-stage private capital in the market, large private companies may find new ways to fund chasing a double curve, although most late-stage capital will probably stick to investing in the relatively more certain reality of a company continuing to build on its initial curve.
Since double curve companies are often publicly traded, they also suffer from investor turnover issues similar to new curve companies. The difference in the case of double curve companies is that they are just seeing the light on the current curve, which may have encouraged public investors that wait for signs of early mass adoption to buy shares, only to change the focus curve. This is compounded by the nature of a double curve company shifting to what it sees as a massive opportunity — it has to be big enough justify moving off of a known curve — and massive opportunities lend themselves to aggressive investment and potentially blitzscaling to capitalize. The combination of a pivot in direction with the potential for heavy investment means volatility in double curve companies can be more severe as compared to new curve companies.
The Mis-estimated Curve
The market often mis-estimates growth curves — both the magnitude (larger or smaller than thought) and the timing (deeper into market adoption or further away). Mis-estimated curves are less of a fourth type of curve and more of a critical factor in assessing how investable the other three curves are. Mis-estimation brings into the curve analysis the sentiment of the overall investor community which prices assets based on its expectations. The best growth investment opportunities happen when curves are mis-estimated by the investor community.
Growth investors should optimize for curves larger than investors realize (underestimated) and avoid those that are smaller (overestimated). Underestimated curves provide a background that allows for business values, even ones that seem rich at the time, to continue to grow as investors adjust to the long-term earnings potential of those businesses. Underestimated curves produce the opposite effect.
The magnitude of the eCommerce curve has been underestimated by investors for much of the last decade. It may arguably still be underestimated despite the value of many of the companies participating in the curve — Amazon, Visa, Shopify, Stripe, etc. — appreciating significantly over the past few years.
Growth investors must be careful with curves that are significantly further away from or deeper into adoption than the investment community realizes. If the investment community believes a curve is on the brink of acceleration into early adoption, but that acceleration is further away than investors realize, equity prices of companies working on that curve will suffer volatility as investors adjust for disappointment when the acceleration doesn’t happen. Likewise, if the investment community believes a curve is still in its early phases, but the curve is actually deeper into adoption than investors realize, equity prices of companies working on that curve will experience volatility as investors assume the market may be smaller than they realized.
Growth investors should monitor curves in the first situation (further away) as disappointment from the community could create buying opportunities for a curve that is yet to come. Growth investors should avoid curves in the second situation (deeper in) because it usually means the curve isn’t that compelling.
New technologies often suffer false starts borne by investor excitement for a new growth opportunity. The Internet crash in the early 2000s wasn’t because the Internet growth curve wasn’t real, the market was just 5-10 years too early in its excitement. Solar suffered a similar fate in the late 2000s and, depending on your perspective, blockchain/crypto may have survived a timing issue in 2017.
Magnitude and timing of a growth curve often go together in that the biggest curves take longer than most people think but end up being bigger than most people think. Estimating the potential size of a curve is more art than science and determining timing of when to invest is a careful balance of the near-term pain of volatility with the long-term gain of a great curve.
Putting the Pieces Together
If we combine the growth curve and its various stages with the concept of mis-estimation, we can build a grid to describe where to focus growth investments.
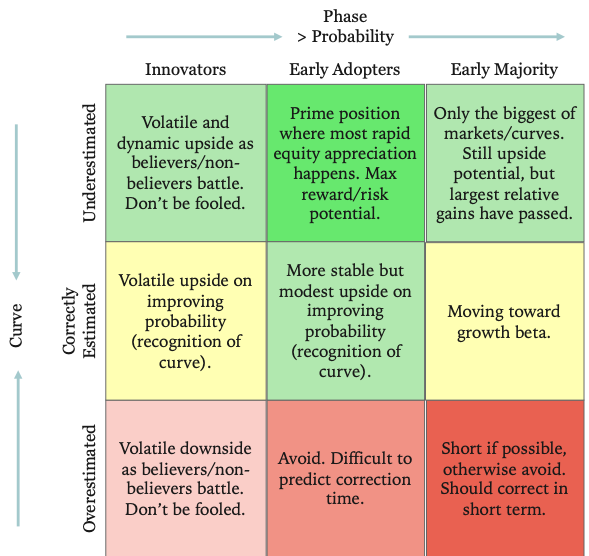
In this framework, the y-axis represents the curve, and the x-axis represents the phase of the curve. As the phase of the curve (x-axis) progresses, the probability that the curve is both real and properly estimated in both size and timing increases. All curves and the companies that participate in them ultimately push to the middle right which we call growth beta where the investment tracks its overall comparable group, public or private.
Estimation and phase of the curve drive valuation of the companies that participate in a curve. As investors identify underestimated markets, they adjust their expectations and mark up the value of companies attacking them, pushing toward the middle. The converse happens for overestimated markets. Also, as the phase of the curve progresses toward full early majority, the probability that market estimates are correct increases, which impacts companies participating in them by reducing a discount rate from uncertainty about the curve, the existence of the curve in the beginning and size toward the end. In other words, the expected value of future earnings becomes clearer for companies participating in the curve over time, increasing valuation.
Growth investors should focus on underestimated markets first and foremost. Underestimated markets are the best margin of safety for growth investors because underestimated markets create a positive revaluation tailwind as the market becomes clearer.
The underestimated market in the early adoption phase is the sweet spot of growth investing. The shift from innovators adopting some technology to the early majority is the biggest relative shift in signal about the reality of the market. The further the curve works through early adoption, the more signal about the market for investors to realize its true potential and adjust expectations as such, creating rapid appreciation in the equity value of participating companies while still leaving forward upside as certainty of the market increases.
Anecdotally, the biggest markets tend to be chronically underestimated by the investor community through the first half of the curve. To the extent you invest in a company that has continually improving market expectations, you should hold at the least and try to double down if possible.
Phase, on the other hand, does not always result in positive revaluation as it progresses despite reducing the discount rate via more market information. The revaluation of an overestimated market can overpower any improvement in discount rate from progress in phase.
Fuzzy Curves and Grids
Value investors rely on their ability to generate fairly clear pictures of the current and near-future state of a business given an assumedly stable market. Growth investors need to consider rapidly changing markets and longer time horizons which make the picture fuzzier. Our curve and grid structures are a useful tool for directional assessment of growth curves but cannot yield precise evaluations.
We can use our grid to roughly map our assessment of various curves for the purpose of identifying ones we think are investment opportunities. An example of some curves in the US:
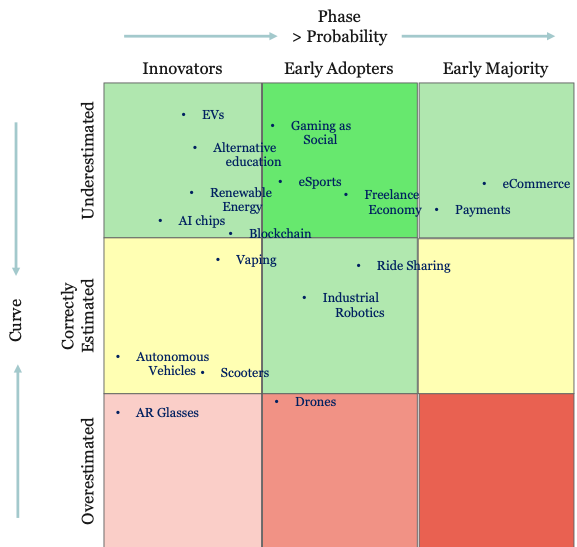
The grid is relative. If it were focused on certain emerging markets, eCommerce, payments, and ride sharing might be further to the left. In some cases, those themes might even be more toward the middle.
The plotting of these various curves is built on data plus intuition. For the EV market, we can assess the number of EVs sold per year and EVs a percentage of total autos owned to get a sense of the current state of the market. We can compare this to an estimate for what the market could be based on the number of cars sold per year, turnover per year, future number of car owners, and other factors to get a sense of the current phase of the curve. Then we can compare our estimate for the market to what we perceive to be the expectations for the broader investment community. This last part is informed by comparable valuations in the space, third party estimates, and sentiment gathered by talking to other investors.
In plotting growth curves on the grid, it can be useful to think of the grid as fractal:
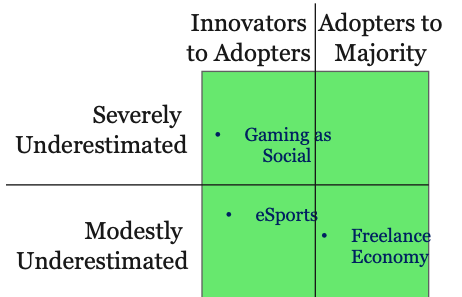
We can think of any box on the grid as a grid itself. Using the top middle box on the grid, we think eSports is in the early adoption phase but closer to innovators than the early majority. We also think the market generally sees some of the opportunity in eSports but not the full picture, so we see it as modestly underestimated. Each of these boxes can also be thought of as a grid and so on. Fractality lends a bit of clarity to a fuzzy process.
Public vs Private Portfolio Construction
There’s one additional factor to add to the curve and grid frameworks that creates one of the biggest differences in public vs private growth investing: the investable universe.
Initial curves are the domain of startups and private investors/VCs. The earlier on in an initial curve, the larger the number of companies to potentially invest in (represented in the dotted line on the graph below). As the curve progresses, fewer companies mature to the next stage.
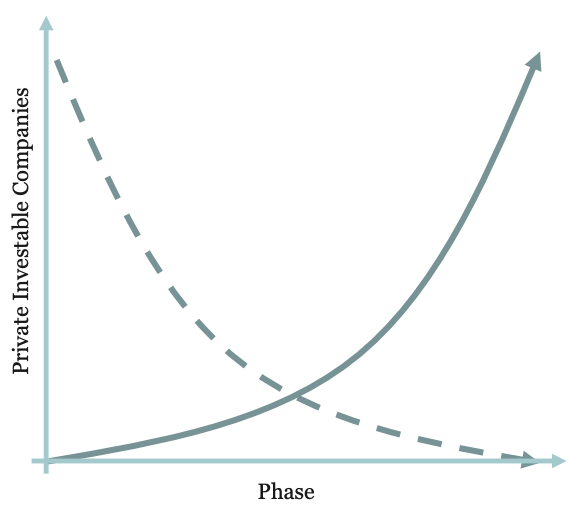
Private growth investors (venture), for the most part, organize into investment focuses that line up with the corresponding phase of the growth curve a given company is in. Early-stage venture investors only invest at that stage because they understand the unique dynamics of companies at the very beginning of a growth curve. Given a large investable universe and potential for massive return from a single investment (power-law return), early-stage venture investors are best served building large portfolios to maximize their chances at hitting a grand slam and more than offset downside volatility from misses. Early-stage venture is about discovery of investment opportunities and access to the best ones.
There are relatively fewer companies that progress into the early adoption phase of the curve, or middle of the grid, which is the focus of the growth-stage venture investor. Given more signal, fewer companies to consider, and greater value-add expectations from portfolio companies including potential board participation, growth-stage venture portfolios should be smaller than those of early-stage investors. Growth-stage venture is less about discovery since the pool is smaller and more about access to the best investment opportunities since there are fewer.
Late-stage venture investors should only invest in companies participating in the absolute largest potential markets. Because so few companies progress to the early majority phase and fit this category, late-stage portfolios are generally even more concentrated. For late-stage venture investors, the game is about access too but with a greater importance on analysis and thesis given there is more to assess than in growth-stage venture.
The public market investment universe looks significantly different. The investable universe is arguably the smallest at the earliest adoption phases (innovator and early market) because the only companies in the public market that work through these phases are new or double curve companies. The public investable universe increases with the level of adoption because of IPOs coming from the ends of late-stage capital in private markets. 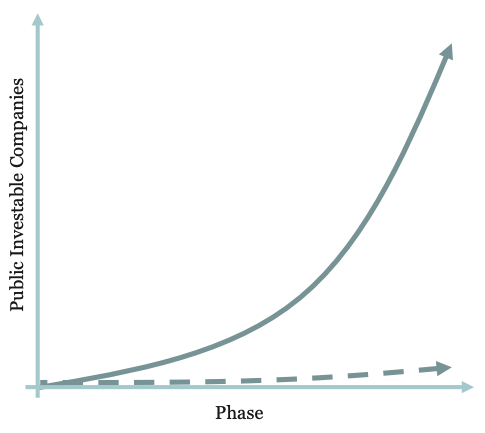
Public growth investors are presented with a difficult challenge. They need to play across all phases of growth curves in an effort to drive superior returns, provided that the relevant companies fit into their market cap focus, but the investment universe is more constrained. There aren’t enough public companies in the earliest adoption phases to build a large portfolio of grand slam swings, nor do public companies in the earliest adoption phases lend themselves to true grand slam outcomes (100-1,000x+) because they are companies on at least their second curve. Public investors also face public marks, exposing the volatility of early growth companies that is obscured by private marks for venture investors. For many public growth investors, this means only playing in the early majority and later phases of growth curves where the volatility is lower and the adoption clearer.
We think this is how growth managers become closer to value managers or, if not value, owners of mega-cap compounders that were once the next great growth investment. Including early curve companies in public portfolios requires timing of the curve, an understanding of what investment will be required to capture the curve, the turnover of the investor base, and some diversity in holdings to offset some volatility risk. Missing early curves in the public market is the path to average long-term returns.
Discipline of a Growth Investor
Figuring out the exact nature of any given growth curve is impossible. An investor’s perception of a curve stays fuzzy for much of the first half of adoption. Curves can even evolve and change shape dynamically over time, flattening and steepening in a reflexive nature.
True growth investing is more art than science. It requires an understanding of customer problems and desires, how technology addresses those problems and desires, the value created for the customer, and ultimately what that translates into in terms of revenue and earnings. Value investing, on the other hand, is more of a science that relies on data about near-term and predictable assets and earnings.
One may think that only science requires discipline. Art requires it equally. Our framework helps us build intuition around how to spot and assess curves but without the discipline to say no to the wrong curves, a growth investor quickly becomes dumb money.